This process will help to analyse the real-time status of Incidents in all dimensions.
This article will be helpful for top management and quality managers to analyse the status of Incidents.
How does real-time trends in the Incidents dashboard work?
Real-time trends of any incident can be viewed in either visually (graphs) and numbers. This numbers or graphs are the data that are represented from the incidents reported from the departments, these are populated on a real time.
What does red or green arrows indicate?
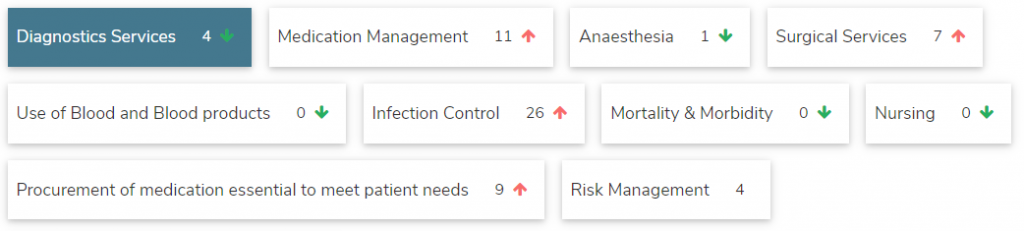
All the categories on the Incident dashboard have an arrow colored green and red, these indicate an increase or decrease in the percentage of incidents in comparison with this month and last month.
The arrow in upwards “↑” is in red which means there is an increase in the percentage of incidents and the downward arrow “↓” is in green which means there is a decrease in the percentage of incidents.
How does insights work?
Insights are produced in relation to the filters applied in the dashboard i.e filters include periodicity, by departments/services. Eg. If the periodicity is selected as 3 months and the department as “BICU”, insights are displayed only on “BICU” and trends of the past three months.
What is “RCA/CAPA” in dashboards?
The RCA/CAPA displayed in the dashboard are incidents that belong to the Incidents dashboard and they work in relation to filter, Eg. If the periodicity is selected as 3 months and the department as “BICU”, incidents of “BICU” with the status of RCA.